.svg)


Breaking your data down into different geographical regions can improve the accuracy of your model. This is because there are more likely to be differences day to day between variables at the regional level, which get smoothed out at the national level. So by predicting regional sales instead, the model has more variance to go on.
For example, if you happen to spend more in the midwest on some days than you did in other regions, the model will be able to pick up that signal to paint a better picture of the impact of your spending.
Unlike breaking the weekly data down to daily, you're not likely to introduce any day-of-week patterns. In addition, by keeping the regions relatively large (north, south, midwest, west), you can avoid adding a lot of noise to the data set.
Building local nuance into models via geo models helps add dimensionality while providing more data to aid generalization and predictive accuracy.
What is a geo model?
It’s very common to lack sufficient data to build an effective marketing mix model (MMM).
Generally speaking, it’s advised you aim for 7 to 10 observations per variable included in the model. So, with 3 years of weekly data, you can support 22 variables.
While that may seem considerable, it’s typically not enough to account for the standard marketing mix, and when you factor in transformations like diminishing returns and adstocks, you might be lacking sufficient data. So for new businesses and startups with less than 3 years of data, it’s essential to maximize resources. One way to do that is by creating a geo model.
A geo model involves splitting data into geographical regions. So, if you advertise in the US and have decent data for each state, you can split data into 50 states.
Naturally, this provides more variance, thus influencing the bias-variance trade-off and increasing model performance to a point. It is possible to go too far, though, and it’s often a matter of including useful geo regions without pushing variance too high.
By using geo models, you can tease out different changes and interactions at lower levels, helping negotiate issues like multicollinearity. Regional analyses can be engineered, e.g., by setting up a deprivation test to turn off spending in randomly selected areas and scale testing, where spending is increased in different regions to understand strengths and weaknesses in the marketing mix.
Building Geo-Level marketing mix models
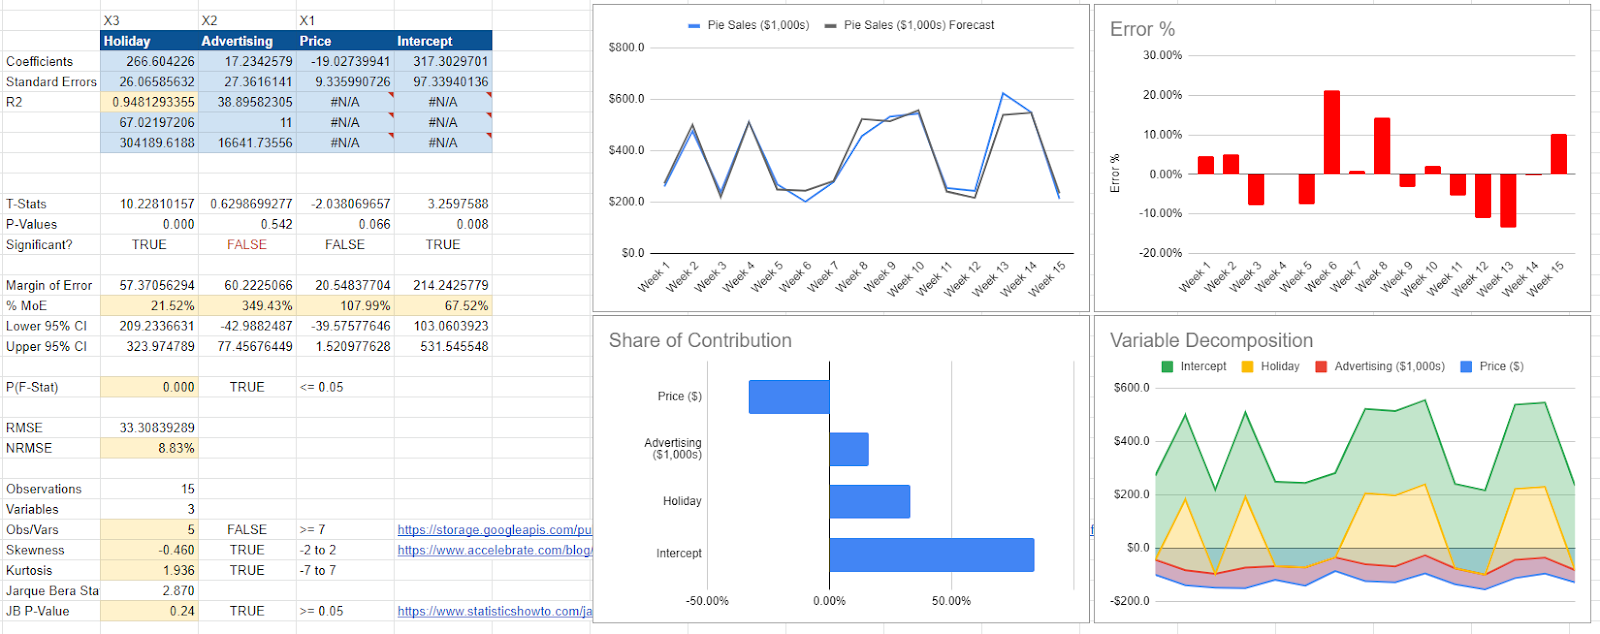
First, let’s look at a marketing mix model at the national level. Here, there are three variables in our dataset: the price of pies, advertising costs, and whether or not it was a holiday that week.
The accuracy here is good, as measured by R-Squared (R2) and the Normalized Root Mean Square Error (NHMSE). So the model says that our three variables predict 94% of the changes in sales (R2) and that on an average day, we’re inaccurate by 8.8% (NRMSE).
Here, advertising drives sales at $17 for every $1 spent. When we increase the price by $1, we lose $19,000 in revenue (sales here are in $1,000s). The variable is statistically insignificant, so we must be wary of our results. Further, we should be wary of our advertising ROI as the model indicates between -$42 and $77 return on ad spend (ROAS).
Geo-modeling
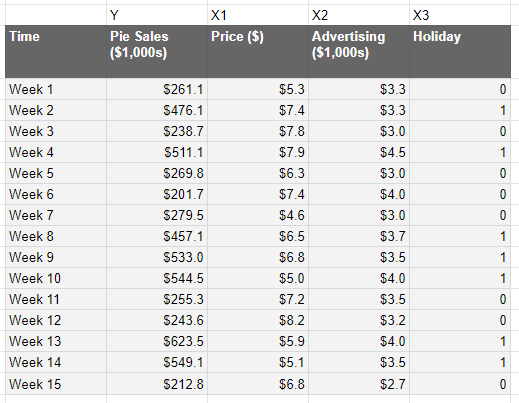
If we want to convert our above model down to a more granular geo level, we first need to change our data. So, we were predicting national data on a given week, which looks something like this:
Regional data looks like this:
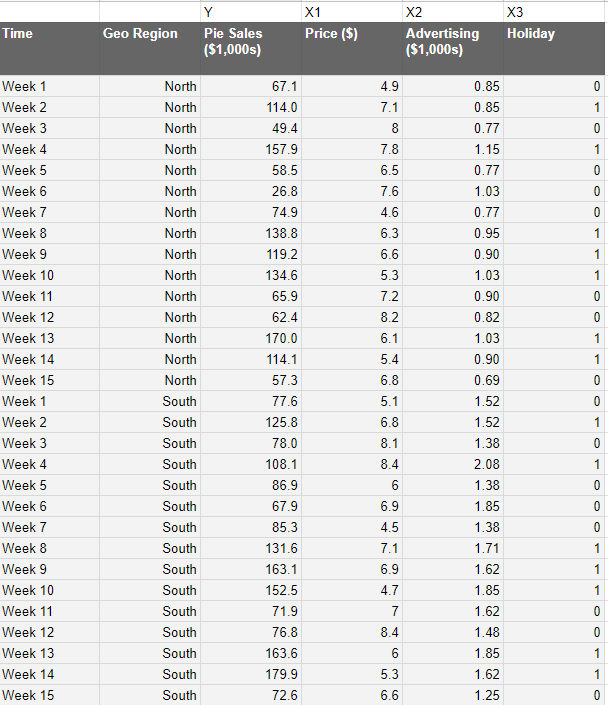
This is assuming we actually possess regional data. If you don’t, then you can use interpolation, where you take the region's population as a percentage of the whole multiplied by the national figures.
Of course, this is an estimate and subject to bias, so it’s highly recommended you obtain genuine regional figures.
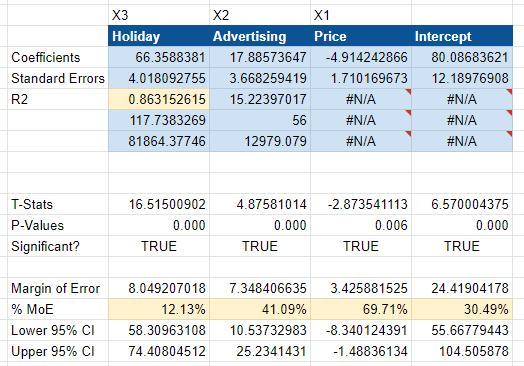
As you can see below, our coefficients have now changed to reflect regional data. It now says the holiday is worth $66k in revenue vs. the $266k indicated at national level. That’s because we have four regions (north, south, east, and west). 66 x 4 is 244, so it roughly equates to what we expect for the whole.
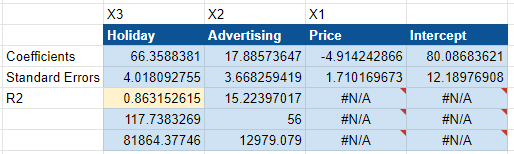
As a genuine experiment, there are genuine limitations. For example, the R2 and NRMSE are both worse than before. You might conclude that the model is worse than it was before, but advertising is now statistically significant, and the model has correctly located a $10 to $25 return on ad spend. This model is much more confident about the impact of ad spending.
How accurate was the geo-level data?
In this model, the example data is generated using random number generations. This enables us to see how close the models are to the ground truth.
Here, the national and geo models are close to the ground truth. The geo model was more accurate for price, with a coefficient of $4.91 vs. $19.03 at the national level.
Overall, the geo model produces a better margin of error and tightens the advertising range, proving that advertising was statistically significant.
You won’t know the ground truth in real life, so statistical significance and margin of error are critical. You can’t look at R2 and NRMSE in isolation, as the model is only effective if it can explain the underlying mechanisms driving the numbers.
Summary: Geo models
Geo models help solve the age-old issue of not having enough data for a model. National data provides a generalization that can be broken down into smaller regions to supply the model with additional variance. There are limits, however, as using too much regional data will introduce noise and other issues.
Splitting national data into regions is a good place to start. In the US, you might go for Northeast, Southwest, West, Southeast, and Midwest.
In the UK, you might go for England, Scotland, Wales, and Northern Ireland. You could even add individual cities, like London and the South East, for the UK.
Once you plug regional numbers into your model, pay attention to what changes. In the above example, the margin of error and statistical significance improved to produce an accurate advertising ROI range.
