.svg)


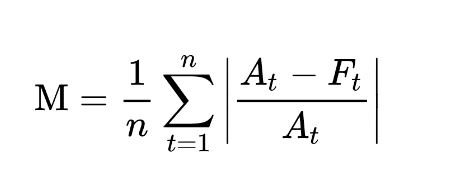
The mean absolute percentage error (MAPE) is a useful and intuitive accuracy measure - it can be interpreted as “by what percent were we wrong by on an average day”?
To find the MAPE, you find the absolute difference (i.e., no minus sign) between your actual values and your prediction. Average this to find the MAE or Mean Absolute Error. Take this as a percentage of the average of y, and you have MAPE.
Generally speaking, a value below 10% is great, 10% to 20% is still good, and above 50% means your model is inaccurate because you're wrong more than you're right.
When to use mean absolute percentage error?
MAPE can be used to find the percentage error between any predicted and real value. MAPE can be applied to any forecasting system, including generic regression problems and time series data.
MAPE is a quick and easy accuracy test to perform and takes mere seconds for most datasets.
But ultimately, MAPE’s simplicity is also its downfall when it’s used without an understanding of its weaknesses.
In short, MAPE is pretty robust so long as there are no extremes in the data. Data must also be high volume to produce accurate results. For example, if the actual figure is 2 and the forecast is 1, the value for the absolute percentage error will be 50%. 50% indicates high inaccuracy, but here, the model is only wrong by a single unit. MAPE fails to capture the accuracy of low-volume predictions.
Strengths and limitations of MAPE
MAPE’s main advantage is its simplicity. It can be calculated in seconds and serves as a quick but meaningful insight into model accuracy.
Advantages of MAPE
- MAPE is very easy to interpret, as it’s expressed as a percentage that is easily compared across different datasets, models, and scales.
- You can calculate MAPE quickly, making it the first port of call for measuring model performance.
- MAPE is easy to explain to others, including clients and stakeholders.
- So long as the use case stands strong against MAPE’s limitations, it’s a robust measure.
Disadvantages of MAPE
- MAPE doesn’t work if there are zero or close-to-zero values (which sometimes happens in demand data forecasting). In this situation, there could be a division by zero. Furthermore, if values are near zero, then MAPE produces extreme results.
- For example, if the actual is 2 and the forecast is 1, the value for the absolute percentage error will be 50% despite the two values being just one unit apart.
- MAPE is asymmetrical. It places heavier penalties on negative errors (when forecasts are higher than actuals) than on positive errors because errors cannot exceed 100% for forecasts that are too low. In contrast, there’s no upper limit for forecasts that are too high.
- So, MAPE results essentially favor models that are under-forecast rather than over-forecast.
- MAPE requires a meaningful zero value. For example, some temperature scales use arbitrary zeros, which renders MAPE useless.
MAPE in a business context
MAPE measures how accurate forecasts are compared to actual quantities, which is extremely useful in all sorts of business contexts that involve forecasting.
Interpreting MAPE is easy, and this measure is highly communicable between clients and customers. For example, a 10% MAPE represents an average deviation between forecasts and actual values of 10%, which applies regardless of whether the deviation is positive or negative.
In real business settings, MAPE is sensitive to how challenging the model is. For example, a business that constantly offers new products, pricing, offers, etc, may have less continuous forecasting models that need to react to short-term changes. In this case, a higher MAPE will be tolerated compared to a business with flat, consistent pricing or marketing structures.
Moreover, as MAPE approaches lower values and zero, it becomes less trustworthy. As a result, some highly seasonal businesses might sell very little in off-season periods, only for their sales to rocket massively later in the year.
In this scenario, MAPE fails to capture the accuracy of forecasts that are near zero compared to those that are well above zero.
Summary: Mean Absolute Percentage Error (MAPE)
Mean absolute percentage error produces a scale-independent metric that can be used to understand and compare model performance. It’s straightforward to calculate and works well for large datasets that contain high-volume values.
As noted, MAPE is only appropriate for larger figures that don’t stray too close to zero. If your data strays close to zero, then MAPE is not appropriate. For example, comparing an actual value of 2 vs. a forecast of 1 will result in a MAPE of 50% despite being just 1 unit out.
